
Ethereum started a recovery wave above the $2,800 level against the US Dollar. must clear the $2,850 resistance to continue higher in the near term.
- Ethereum started a decent recovery wave above the $2,780 and $2,800 levels.
- The price is consolidating above $2,820 and the 100 hourly simple moving average.
- There was a break above a major bearish trend line with resistance near $2,750 on the hourly chart of ETH/USD (data feed via Kraken).
- The pair must clear the $2,850 and $2,860 resistance levels to continue higher.
Ethereum Price Faces Resistance
Ethereum followed a bearish path below the $2,850 pivot level. ETH even traded below the $2,800 support level and the 100 hourly simple moving average.
It traded as low as $2,718 before the bulls appeared. Ether price started an upside correction and climbed above the $2,750 level. The price was able to surpass the $2,800 resistance. There was a clear move above the 23.6% Fib retracement level of the key decline from the $2,980 swing high to $2,718 low.
Besides, there was a break above a major bearish trend line with resistance near $2,750 on the hourly chart of ETH/USD. The pair is now consolidating above $2,820 and the 100 hourly simple moving average.
On the upside, an initial resistance is seen near the $2,850 level. It is near the 50% Fib retracement level of the key decline from the $2,980 swing high to $2,718 low. The next major resistance is near the $2,880 level. A clear move above the $2,880 resistance might start another increase.
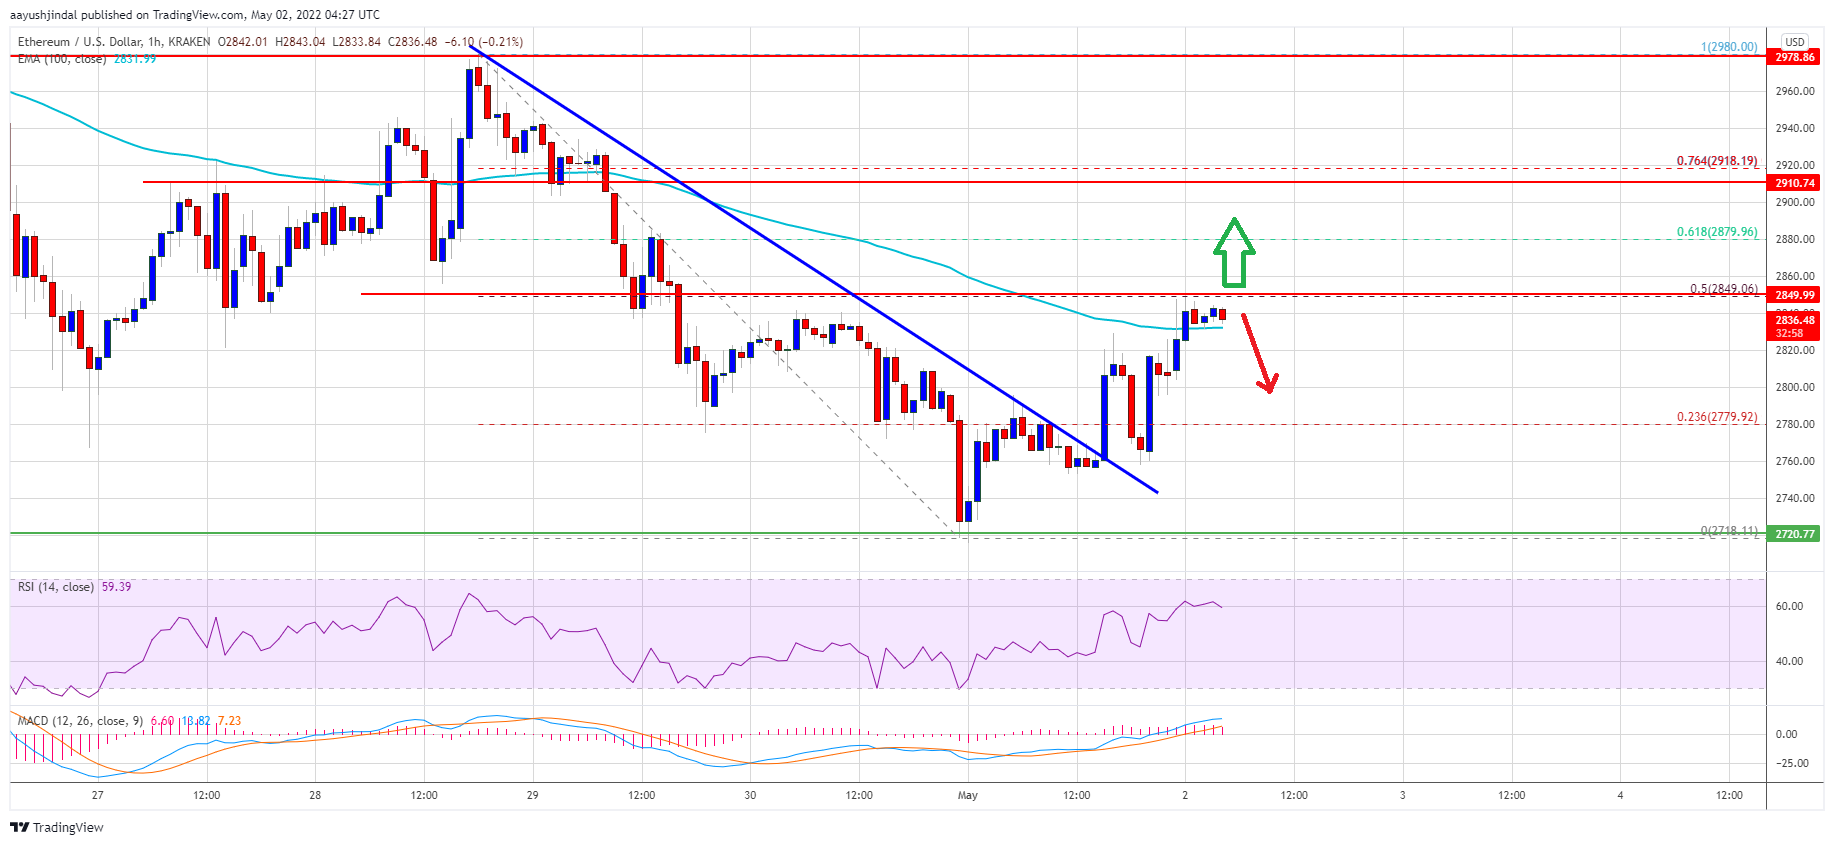
Source: ETHUSD on TradingView.com
The next major resistance on the upside might be $2,920. Any more gains may perhaps send the price towards the $3,000 resistance in the near term.
Fresh Decline in ETH?
If ethereum fails to gain pace above the $2,850 resistance, it could start another decline. An initial support on the downside is near the $2,800 zone.
The first major support is near the $2,750 level. If there is a downside break below the $2,750 support, the price could revisit the key $2,720 support zone. Any more losses may perhaps open the doors for a larger decline towards the $2,650 level or even $2,620.
Technical Indicators
Hourly MACD – The MACD for ETH/USD is now losing pace in the bullish zone.
Hourly RSI – The RSI for ETH/USD is above the 50 level.
Major Support Level – $2,800
Major Resistance Level – $2,850
Hey! Do you know if they make any plugins to assist with SEO? I’m trying to get my blog to rank for some targeted keywords but I’m not seeing very good results. If you know of any please share. Appreciate it!