
Cardano (ADA) exhibited strength over the last 24 hours as the coin rallied by almost 25%. With Bitcoin trying to climb up on its chart, altcoins have reflected the same price action. Broader market seems to be regaining its lost momentum with major market movers showing signs of recovery.
The global cryptocurrency market cap today stood at $1.38 Trillion with a 3.6% increase in the last 24 hours. The buyers have re-entered the market after the bears failed to drag the price below the $0.40 support line.
Cardano bounced off the aforementioned support line and started its journey towards recovery. Cardano happens to be one of the top gainers across the industry today. The demand for the coin surged and as a result the coin continued to break past several key resistance levels over the last 72 hours.
Cardano Price Analysis: One Day Chart
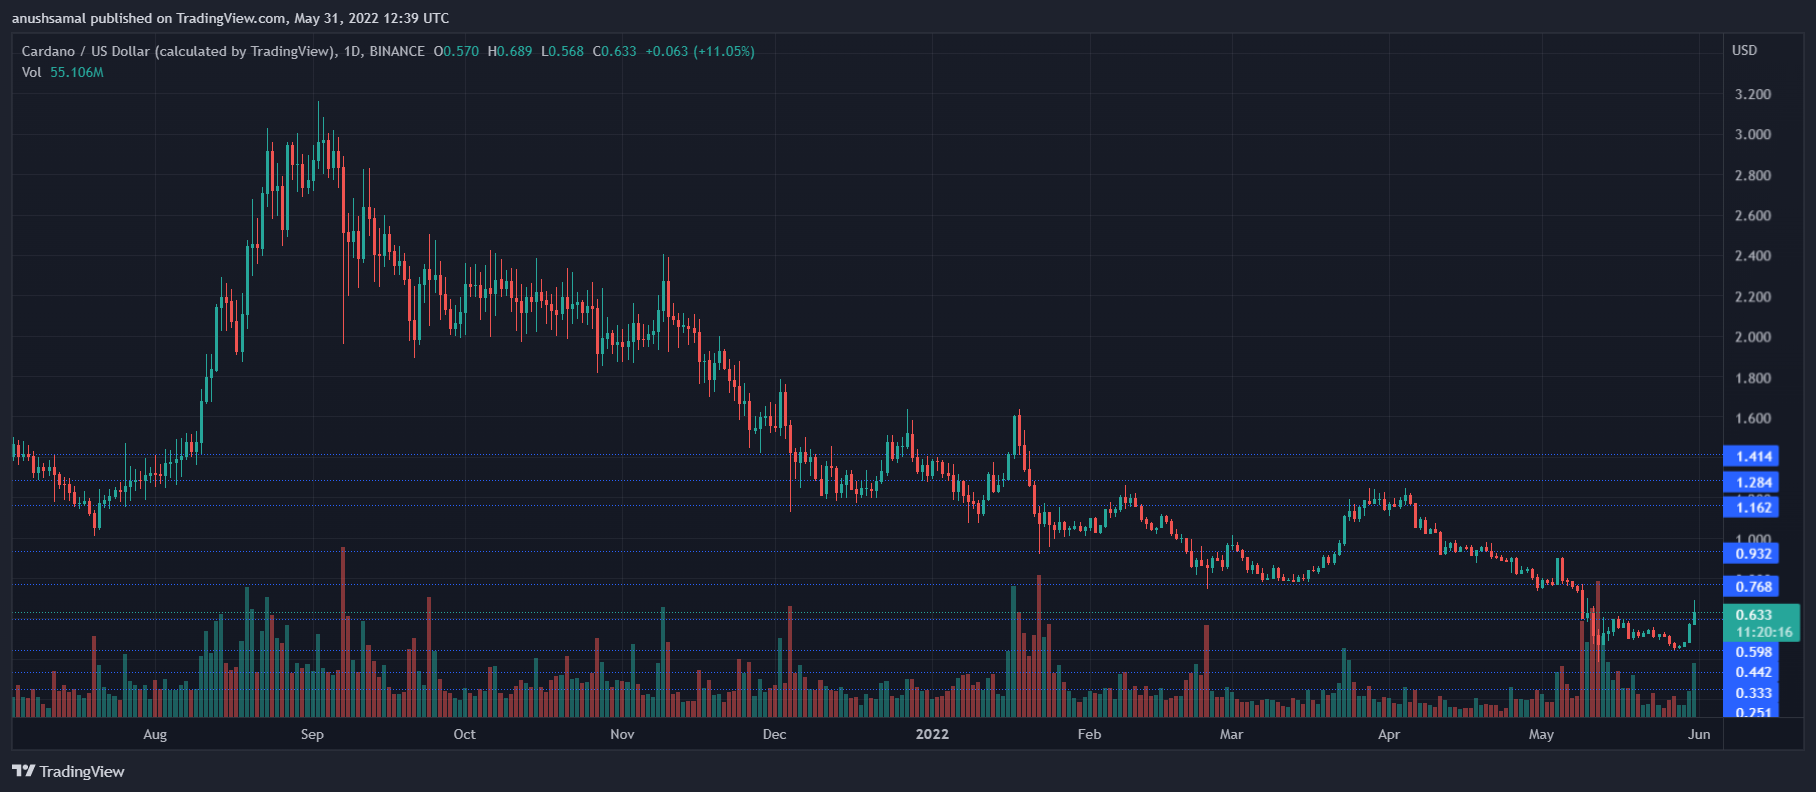
ADA was priced at $0.63 at the time of writing after rallying over 25% in the last 24 hours. The coin broke past many resistance marks and has now found support near the $0.50 price level.
In case demand starts to drop, price might end up near the $0.59 to $0.50 mark following which the support level rested at $0.40.
Overhead resistance for Cardano was at $0.78 and then at $0.93. For the bulls to firmly establish themselves, the altcoin has to aim for $0.78.
Volume of ADA traded in the last trading session was high. The bars appear green which is a sign of positive price action signifying that buying strength increased in the market.
Technical Analysis
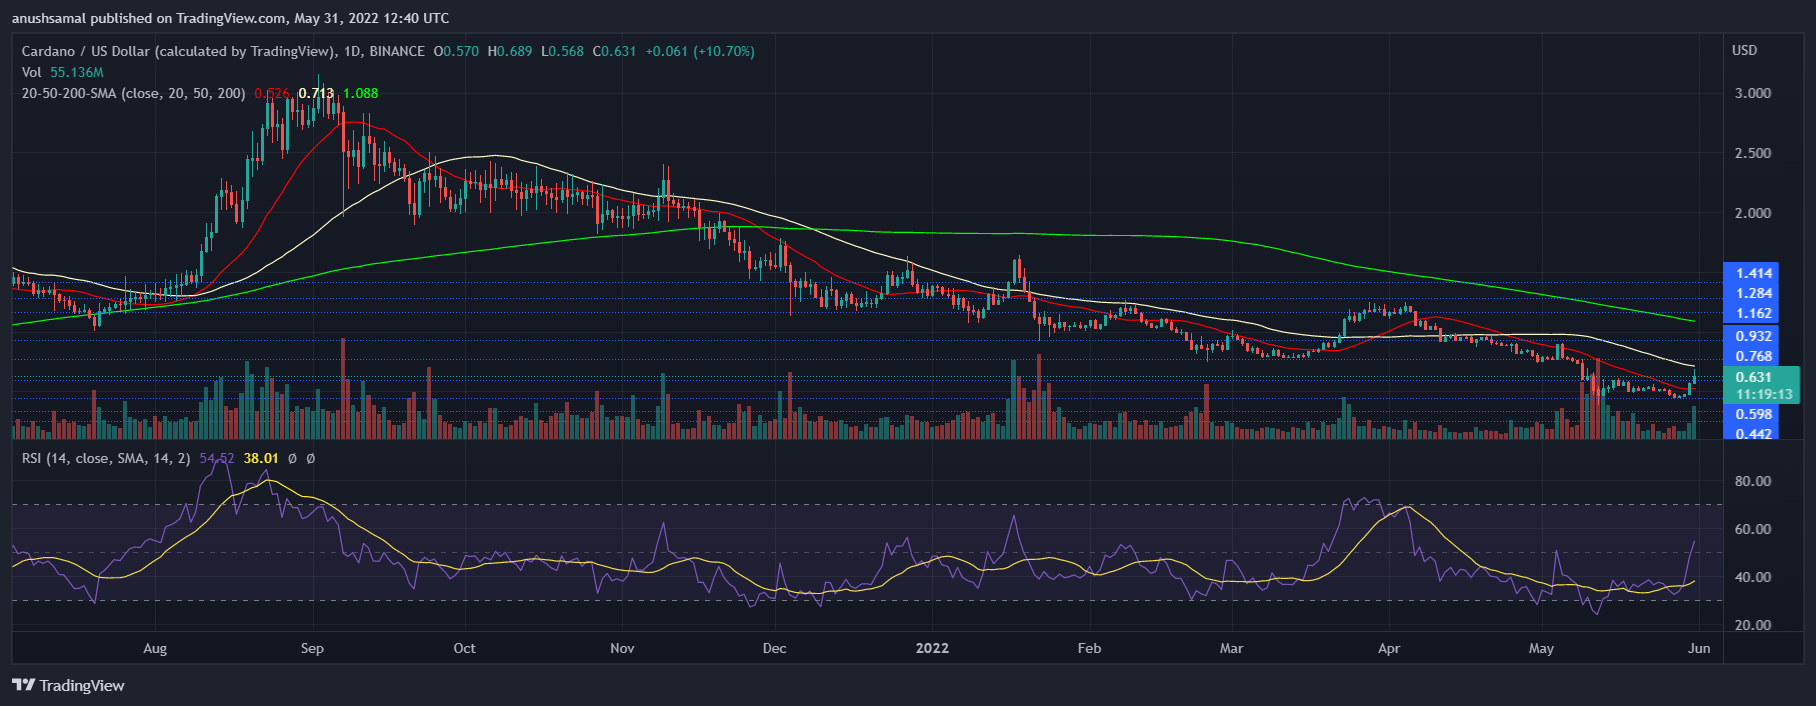
Demand for ADA rose as seen visible on the one day chart. In correspondence to the same, ADA’s price was above the 20-SMA line.
This reading signified that buyers were in charge of driving the price momentum of the market.
A push from the buyers can drive the price above the 50-SMA which would be a sign solid bullishness. In relation to the buying strength, Relative Strength Index rose sharply past the half-line.
A reading above the half-line indicated buyers outnumbering sellers in the market.
Related Reading | Cardano (ADA) Continues To Sink, What’s Next For The Coin?

Awesome Oscillator displays the current as well change in the price momentum. The indicator displayed green signal bars that highlighted a bullish price momentum.
AO also displayed buy signals which corresponded with the RSI. The Chaikin Money Flow indicates the amount of capital inflows and outflows.
The CMF was above the halfline, which meant that capital inflows were more than capital outflows at the time of writing.
The indicators although bullish might not be enough to validate the current bullish thesis. Sustained increase in demand for the coin along with market strength can help the bulls to sustain the price action.
Related Reading | TA: Ethereum Tests $2K, Why ETH Could Extend Rally