
As the Bitcoin price declines to $40k, on-chain data shows long-term holders have harvested some profits recently.
Bitcoin Long-Term Holder SOPR Shows Some Spikes Recently
As pointed out by an analyst in a CrypoQuant post, some BTC long-term holders seem to have participated in profit taking over the past day.
The relevant indicator here is the spent output profit ratio (or the SOPR in brief), which tells us about the profit ratio of the whole Bitcoin market.
The metric works by checking the past history of each coin being sold on the chain to see what price it was moved at before. If this previous price was less than the current one, then the coin moved at a profit.
Similarly, if the current price is higher, then the investor sold this coin at a loss. When the value of the SOPR is above one, it means investors are, on average, selling at a profit right now.
Related Reading | Bitcoin Sentiment Reaches Local High, But Can’t Shake Recent Fear
On the other hand, when the indicator’s value is less than one, it implies investors are selling at a loss overall at the moment. SOPR value exactly equal to one naturally means the market is just breaking even right now.
A version of this Bitcoin indicator takes into account only those coins that hadn’t moved for at least 155 days before being sold. This supply belongs to the long-term holders, and the metric is called LTH SOPR.
The below chart shows the trend in the BTC LTH SOPR over the course of the month so far:
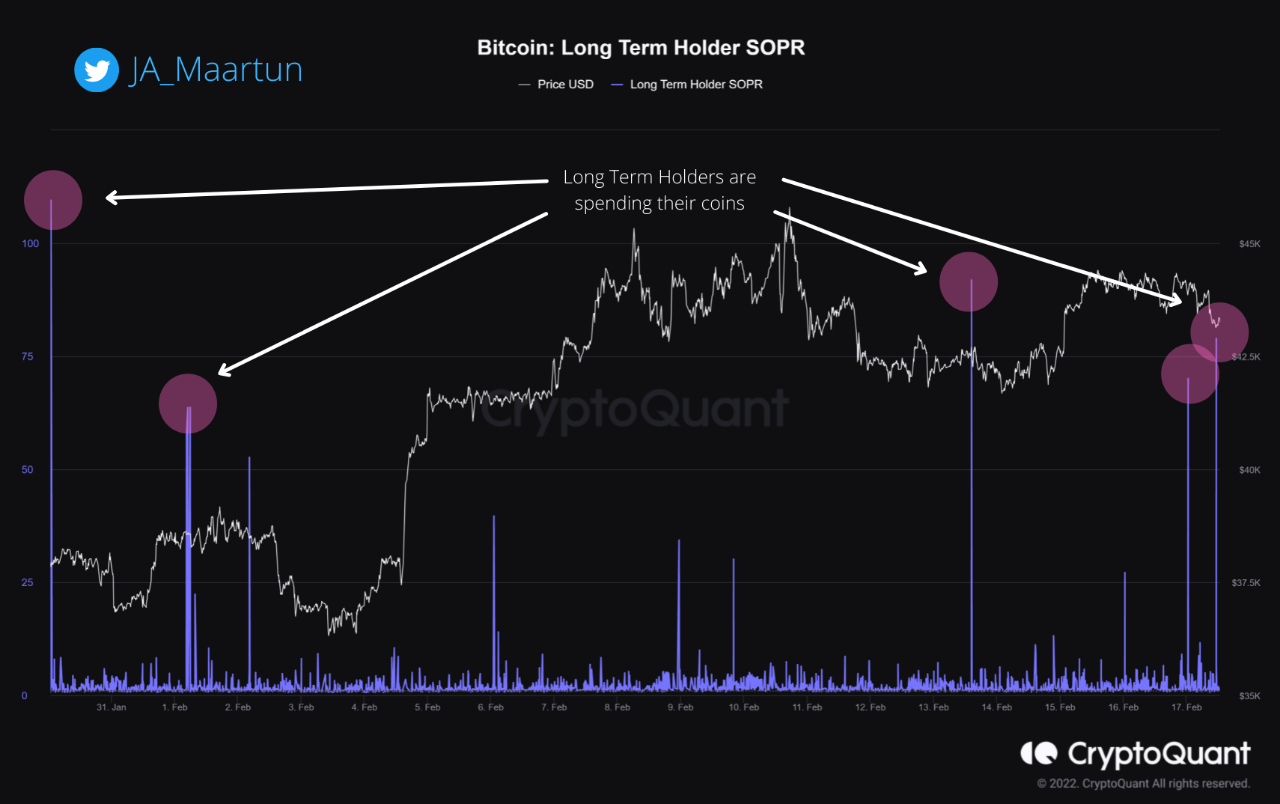
The indicator's value seems to have spiked up recently | Source: CryptoQuant
The quant has marked the especially large spikes of the Bitcoin LTH SOPR in the above graph. At those points, the long-term holders look to have harvested some profits.
Such a trend has often been bearish, as can be seen in the chart that the price struggled following these large spikes.
Related Reading | Here Are Two Scenarios For Bitcoin A Month Prior To FED Announcing Possible Interest Rate Hike
So, it’s not surprising that the price of the crypto crashed down to $40k shortly after the latest spike in the indicator.
BTC Price
At the time of writing, Bitcoin’s price floats around $40.3k, down 7% in the last seven days. Over the past month, the crypto has lost 5% in value.
Below is a chart that shows the trend in the price of the coin over the last five days.

BTC's price seems to have plunged down over the past twenty-four hours | Source: BTCUSD on TradingView
Just a couple of days back, the price of Bitcoin seemed to be approaching another retest of $45k, but over the past day, the price has fallen down hard to $40k instead.
Featured image from Unsplash.com, charts from TradingView.com, CryptoQuant.com